" "

metrics

HOW TO: How to Limit WIP #3–Reducing Interruptions

22069889_2fec506fbb

Four hours ago, I walked up to a big pad of paper and started mind mapping all the types of interruptions we might face while trying to get our work done.

  • While I was working, Tonianne, who was on Skype, wanted to do a microphone test.

  • Then I received an e-mail for a meeting request from a client.

  • While responding to that, I received a lunch request from a colleague.

  • While responding to that, e-mail arrived from another client with documents needed for our meeting. So I accepted those Google docs and scanned them.

  • While responding to that, my bladder told me that I should rush off for a bio break.

  • After that, I rushed to the board and started writing furiously about things that might interrupt us.

  • Then Tonianne wanted to discuss some work that was coming up.

  • Then I had my meeting.

And now, 3.5 hours later, I am finally writing this blog post.My goal is to get this done by my call at 1 pm.How do we limit our work-in-progress in a world of constant interruptions?Interruptions are more common in knowledge work than work, it seems. They are little things, one minute, five minutes, ten minutes. Happening here and there.

What is an Interruption?

The Free Dictionary defines Interruption as:

in·ter·rupt (nt-rpt)

v.in·ter·rupt·ed, in·ter·rupt·ing, in·ter·rupts

1. To break the continuity or uniformity of: Rain interrupted our baseball game.

2. To hinder or stop the action or discourse of (someone) by breaking in on: The baby interrupted me while I was on the phone.

3. To break in on an action or discourse.

All three of these are important to us at work. While we are working, we are achieving (hopefully) a state of flow. Both in the psychological and the mechanical sense of the word, we are actively focusing, working, and completing the task at hand.An interruption is anything that breaks that flow-state. <The phone just rang. On call for 2m13s.>When we break that flow state, just like that side comment about my own interruption broke up the flow of this post, we have several states we transition through:

  1. Initial shock (Oh my god, I’m being Interrupted!)

  2. Adjustment (Context switch into new context)

  3. Existence (Live in new context)

  4. Closure (Close off new context)

  5. Return (Return to previous context)

Depending on the detail needed by the interruption, these states can take take minutes, tens of minutes, or more. Luckily for me, my interruption was minor and rather fun, so leaving the blog post and coming back was relatively easy.

Interruptions and You

Since most interruptions are small, routine, and often important, we tend not to notice them. When interruptions are annoying, we do notice them. Then, when we are late in finishing something, we will blame our lateness on the annoying interruption and conveniently forget all the other ones.The fact is that interruptions are part of knowledge work. We seldom do it alone, which means we have colleagues. Colleagues require information. Information requires communication. Communication requires attention.We are also social animals. So, if I come into your office and say, “Hey, I need to talk to you about the Amalgamated Salamander contract,” you are likely going to say, “Okay,” and we’ll talk. Even if you say “No,” you are unlikely to simply say “No,” and ignore me from then on, because that’s rude. And if you are truly rude, you will not stop at “No,” you’ll tell me exactly why you don’t have time for me which is still an interruption.We cannot declare interruptions as waste, either. Knowledge work and personal work is fraught with rapid changes in context. Micropriorities that never existed on your project plan crop up every day. Like “Hey, Barb’s out sick, you still want to have that meeting?” Or “I just got this fax from the FDA and they are claiming that epoxy isn’t a food and we have to pull our Gluey-Chooies off the market.” Things like that.So, we need to understand what our interruptions really are, before we decide that we want to eliminate them.There are many systems out there to help you isolate yourself from interruptions, but completely closing yourself off from change – in an environment with high degrees of change – doesn’t make a lot of sense.

Understanding Interruptions

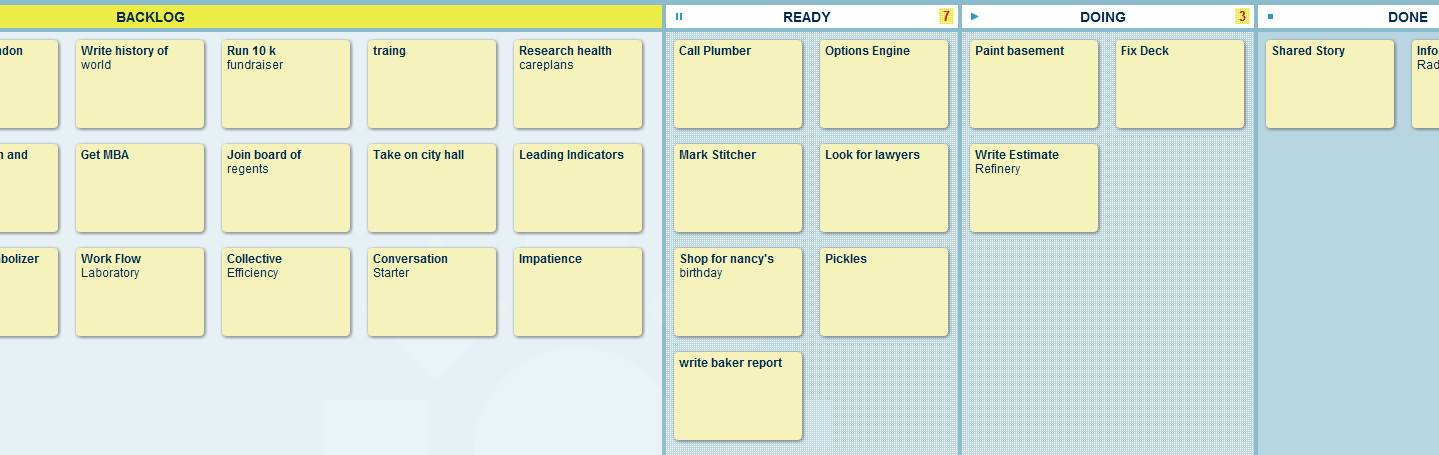
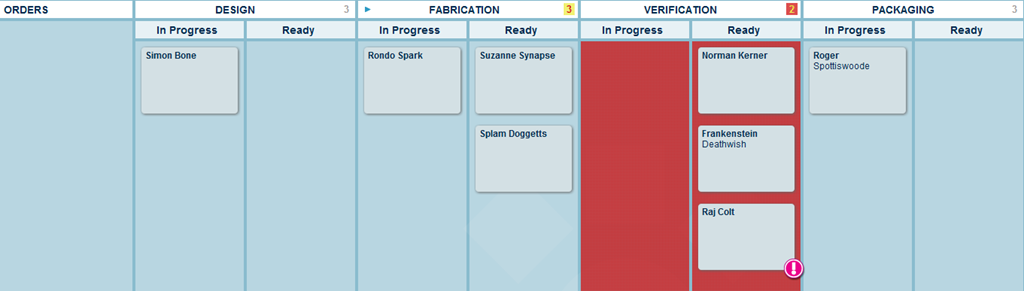
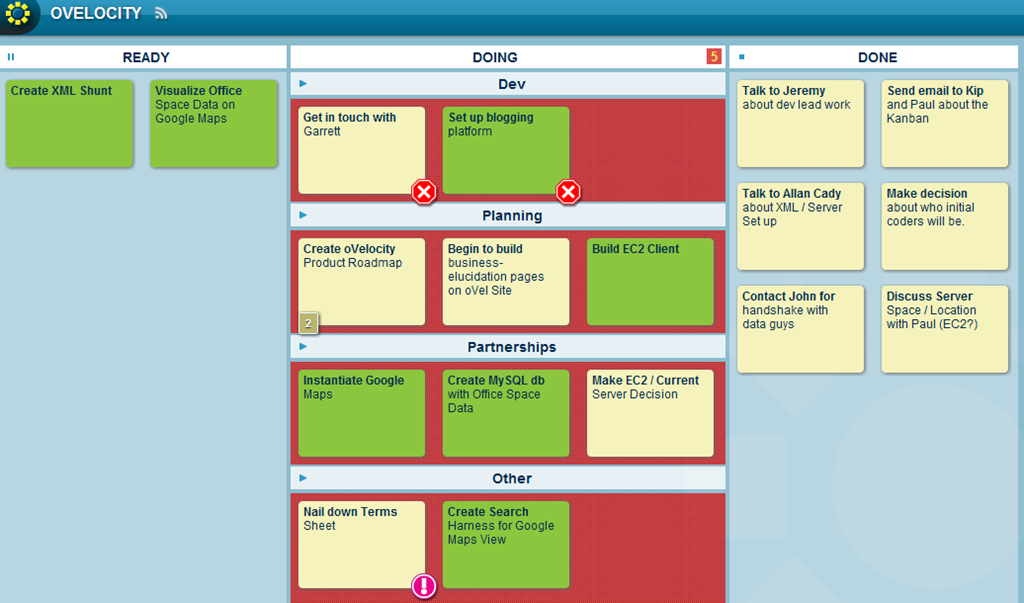
In order to know a thing, you must become a thing. So, you must first go out and interrupt as many people as you can.No … scratch that.In order to understand interruptions, a good place to start is to (surprise) visualize them. Here are some suggested ways in increasing levels of complexity.Write Them Down: That’s simple enough. Keep a pad of paper nearby and when you are interrupted by ANYTHING write it down. Even if you are interrupted by daydreaming about how awesome lunch is going to taste.Add Them to Your Kanban: Get a special shaped sticky notes, like maybe ones shaped like the human cochlea (or something) and add substantial interruptions to your board. This way you can track them and see them mixed with your other work.Record Severity:  Create a table on a sheet of paper. 8 rows for the hours of the day, and 12 boxes for five minute increments. Then color in the boxes during which you were interrupted from your primary task.Now that you’ve recorded them. Ask some key questions:

  • Are these interruptions necessary?

  • Did I provide or receive value while involved in this interruption?

  • Does this interruption happen frequently?

  • Can I schedule this interruption, making it a planned event?

  • Did I have the time and mental capacity to help with this interruption?

Again, the goal is not to eradicate interruptions. The goal is to understand them and work with them. Some will be waste and you can remove them. Some will be part of your job and you must find elegant ways to work with them.

Limiting Work in Progress

After you understand the nature of your interruptions, you can build much more resilient strategies for limiting work-in-progress. We can limit unnecessary interruptions, understand when it is appropriate for us to sequester ourselves in a Pomodoro, and structure our work to allow us to stay as much within our WIP limits as possible.Photo: “Dorrie Interrupts Sissy Bathing” by Paul Schultz.

The Estimate Refinery–Element #5 of the Kanban

In our book Why Plans Fail, we discuss something called the Planning Fallacy and, as is pretty apparent by its name, how it mucks with our ability to plan. It turns out that we’re quite unskilled at planning. As a former urban planning and large project manager, this was both a relief and demoralizing … and even frightening.Much of our lives are based on judgment calls - on making spot estimates about everything. So, let’s take a look at some estimates we might make:1. “I estimate that car three blocks away will not hit me if I cross the street now.”2. “I estimate these eggs have 2 more minutes.”3. “I estimate that this massive 15 million dollar project will be done in exactly 12 months and take exactly 300 people and will require exactly these tasks to be done in exactly this order each taking exactly this much time.”Which of these three stand the least chance of being correct?If you guessed 1 or 2, then you’re just trying to be wrong. It’s pretty apparent that #3 is a very large thing with many moving parts and a huge helping of unknowns. Yet we frequently estimate work for ourselves or others and then are disappointed when we are wrong.We are wrong for a variety of reasons:

  1. We don’t understand the role of variation in our work

  2. We are estimating before we’ve started the project and are simply underinformed

  3. We are trying to meet a deadline that is shorter than the time it would take to create a quality product

  4. We are trying to come in as a least-cost bid

  5. We are trying to get work done while understaffed

  6. During the project is snows, rains, tornadoes, floods, earthquakes, locust plagues, or other bizarre thing that seems to happen during every project

  7. We don’t want to look “slow”

  8. We don’t have time to do a thorough review

  9. It is politically inadvisable to say what the real estimate is, so we give a lower one and hope to find efficiencies to make up the time

  10. We think about “ideal” hours and estimate based on how long we think we could personally do the work if we were totally focused and never interrupted

This list could seriously go on for days.Personal Kanban is helpful here because we can begin to track the amount of time it takes to actually complete our work. There are two metrics here: Lead Time and Cycle Time.Lead time is the amount of time it takes to get a ticket from its creation to its completion. Cycle time is the amount of time it takes to get work from the start of actual work to completion.Key here is how we manage our backlog. In most of the Personal Kanban writing, we assume that the backlog is an open repository for all demands. If that’s the case, then it has no limit and we really can’t measure anything against it.However, if we set up something like the system below:Here we have a “backlog” which holds all our prospective tasks forever. So every project we might want to do, goals, whims, it’s all in there. In our “ready” column, however, we have a 7 ticket limit. That limit means that when something enters ready it is probably going to be moved to doing very soon.With this limit we can begin to gather planning-level metrics. So:Lead Time = [Date / time ticket moved into DONE] - [Date / time ticket moved into READY]This says, from the moment something hits my ready column, it takes Lead Time to be completed.Cycle Time = [Date / time ticket moved into DOING] - [Date / Time ticket moved into DONE]This tells us that when we start working on something, it takes Cycle Time to complete.With these numbers we start to see variation in our work. We will see it in a variety of ways.

  • Variation in the set - So we have a set of numbers now that show how long it takes us to complete tasks. Some of them it takes a long time to complete, others it takes a short time to complete. If we graph this, it shows the dispersion of task completion times we have had.

  • Variation in “like” tasks - Let’s say you do the same thing repeatedly. Like checking up on one of your large clients. Usually it is as simple as calling and having a quick 5 minute phone call. But sometimes it doesn’t go right. They have an issue, or maybe they’re just chatty, and you find yourself talking to them for an hour and a half. The task “checkin with client” was the same, but the amount of time it takes to complete it can change. Instinctively, we know this happens, but we never account for it in our estimates.

  • Unforeseen events - Let’s say you’ve designated on task to take 8 hours. You have a week before the deadline and all is good. The day before you’re going to complete it, there is a blizzard that keeps you from completing it for six days.

Most of the time, our estimates are wrong. Often it’s due to us simply not understanding our own work. We don’t understand how often we are interrupted, the role of variation in our work, or simply the work itself. With the kanban and Personal Kanban, we are able to see work as it happens, notice bottlenecks, and measure real completion time.As we see this, we are able to refine estimates on the fly.This is post #5 of the Elements of Kanban Series, click for the full list of 13.

A Leading Indicator–Element #4 of the Kanban

Bottleneck in packaging

overloaded team

smilee board

It seems we’re addicted to metrics. People believe that if you measure something over time, you'll see patterns in the data and act on them. The problem is that most metrics are lagging indicators. These are metrics that can tell you why something happened, but they rarely warn of things that are happening or are about to happen.

While lagging metrics are not necessarily bad, it should be fairly apparent that learning of problems after they've happened does little to help you avoid them in the first place.Kanban and Personal Kanban are real-time systems that provide real-time and leading metrics. The board tells you what is happening, as it is happening.

Patterns in real-time movements help you predict events in the future. While the board is more than capable of creating great lagging indicators like Cumulative Flow Diagrams (CFDs), its real strength lies in showing status in a way that helps avoid missteps and pitfalls.Let's take a look at a few design patterns that exemplify this:In this board we see a fairly standard bottleneck.

Work is flowing smoothly through verification, when we reach packaging we see a bottleneck made explicit by the backup of tickets. When we arrive at a situation like this, the group or groups doing the work have the opportunity to correct immediately. In this case, fabricators can help in verification or might take some time to improve the shop, we may bring in other verifiers, or whatever corrective action might be necessary.

This problem becomes explicit immediately - the moment it happens everyone knows there is a bottleneck that is impeding workflow. There is no need for detailed reports, meetings, or blame - the backup is simply there and  should be addressed.In this board we see a team with too much work.

Their WIP limit is five, and yet they have ten tasks in flight. We also see that people downstream have nothing to do. This is a classic knowledge work problem - workers upstream take on many tasks, cannot complete them all in a timely way, and workers downstream starve for work.

The logical result of this is that the workers upstream will finish all the tasks (somewhat sloppily) towards the end of the deadline, leaving downstream workers little time to do their work. Since the work was done somewhat sloppily, the effort required by downstream workers increases with very tight deadlines. That results in further corner-cutting, resulting in a still more shoddy product.However, our board is showing this up front.

Encouraging workers upstream to adhere to their WIP limits allows them to focus on quality, complete work earlier, and get product to downstream colleagues such that they also have time to do a quality job.Knowledge workers have only one critical piece of machinery, it's their brains. Since the 1950s, we've known that workers in a positive state of mind do a better job  - they work faster, the estimate more honestly, they innovate more.

We can use the kanban to track what psychologists call Subjective Well Being. SWB tends to be a remarkably good indicator of  people's emotional frame of mind. If people in a good mood really do tend to do better work, doesn't it make sense to track how they are feeling? Here we see a board where workers are tracking how they are feeling about particular tasks flowing through their kanban. In you come in and everyone looks happy, then things are probably going well. But if a team is all reporting angry faces, the team is angry RIGHT NOW. Right now their performance is likely impaired.

Do you really want to wait a few weeks and have a meeting about this?  No, the problem is there now, the performance is impaired now - the cost of nipping this problem in the bud is currently at an all-time low. It's not fun to fix this problem, but it is very necessary.

There are many other leading indicators you can get from your Personal Kanban, these are just a few. Use your board to see what’s happening in real time and fix problems in real time. Don’t wait for later. Usually waiting to solve a problem allows that problem to grow, making it more problematic, emotionally draining, and expensive to solve.This is post 4 of a 13 part series. See the full listing of 13 Kanban Elements posts here.*Boards 1 & 2 were made in Lean Kit KanbanBoard 3 was in Google Draw

The Language of Metrics: Lean Muppets Series Post 4

It’s like a really heavy iPhone.

muppet brrrring scale

Silly aliens!In business, we mistake inanimate objects for our customers, our employees, our teams, and everyone else. Our inanimate objects are metrics. Just like the telephone, they are things we make to convey information, but we make a key mistake: we believe that metrics are in some way arbiters of reality.But just as we are what we eat, we become what we measure.The aliens here are vice presidents coming down to talk to the workers.They descend in their ship and approach the area in which their intelligence tells us the workers reside.In lean parlance, they are going to the gemba.Now, here's the really funny bit: the telephone really isn't the metric. The worker is the worker.These are workers who have been supplying management with meaningless statistics that measure output on a dual axised BRRRRRRRING scale. The longer and louder the BRRRRRRRING the better.The managers approach the worker who, after getting three consecutive raises for BRRRRINGing like there's no tomorrow, is on the fast track to becoming an alien.  That worker, after a time, does everything to satisfy the metric - to the point that it becomes the only way he can conceive of doing his job.Initially, the managers approach the worker and try to discuss things in English, then hunt around for other languages, only to learn that BRRRRING is all anyone can say.And the scary part is the end, where they are happily BRRRINGing along with the employee, because now it's the only thing the company can say.In his 14 Points, Deming said "Eliminate management by numbers and numerical goals. Instead substitute with leadership."  The more we rely on metrics to tell us what happened, the more we distance ourselves from the actual work being done. We lose sight of changes in context and cannot deftly react when necessary. Further, we build games and systems that reward paying attention to the metric and not the success of the company.People will care about what the system cares about. If your company has reams of reports generated daily or weekly, you are not "managing by the number" you are building a culture of BRRRRRRING.This is fourth in a series of Lean Muppet posts. For a list of Lean Muppet posts and an explanation of why we did this, look here. -> Lean Muppets Introduction

One Day’s Idea is Another Day’s Waste

3369218571_76098b8085_n

On my travels through startups and the corporate world I see small to gross acts of negligence. They usually come in the wrapper of something like, “because that’s our process.” Metrics are gathered for the sake of reports no one acts on. Information is collected to feed otherwise ignored databases. People fill out forms to protect the company from a long-forgotten infraction.Policies and processes we adopt over time are corporate inventory. We have to maintain them, administer them, and be annoyed by them. All these actions are waste.The tricky thing here is that all policies can be defended by “what if” arguments. “We can’t get rid of that policy … what if someone does something bad?”Well, what if someone does something bad? How likely is that to occur?We know for certain that the waste is making the group less effective when subjected to the policy. What is the likelihood of your What If?A gross example of this is airport delay post 9-11. The 9-11 hijackings had nothing to do with airport screening points. They were a systemic breakdown (and a highly improbable one) of the global intelligence network. Yet, the 631,939,829 people who flew in 2010 all were delayed at least one hour by needing to get to the airport early, stand in line, and subject themselves to security policies. At about 40,000 as an average income, this quickly pencils out to about 12.5 billion dollars worth of delay every year. That delay can be easily compounded by the lost time of collaboration that people have endure by leaving the office early.The What Ifs here are obvious. But so are the costs. Are there better ways of dealing with terrorist threats than incurring billions of dollars in passenger delay?Other examples are regular reports that show the progress of various business metrics. One company we visited generated a weekly report of dozens of pages and nearly 100 metrics every week. Not only did report generation take more than a combined 40 hours to produce (an obvious cost), it delayed the very projects it was trying to measure. In the end, the overwhelming number of charts, graphs, and numbers created a culture of managing by the numbers while totally ignoring what was really happening. Managers would comb through the document until they found the metric or two that went in the wrong direction, then they’d come to find out why.More often than not, the why was a normal fluctuation in the number. The conversation was waste, the “analysis” was waste, and the generation was waste. But those receiving the report had become so fixated on it that they couldn’t see beyond it. “What if we didn’t have this report? We’d never know what was going on!”Examine your policies regularly. Make sure that you don’t have policies to create waste. Photo by Anders V

" "