" "

The Estimate Refinery–Element #5 of the Kanban

In our book Why Plans Fail, we discuss something called the Planning Fallacy and, as is pretty apparent by its name, how it mucks with our ability to plan. It turns out that we’re quite unskilled at planning. As a former urban planning and large project manager, this was both a relief and demoralizing … and even frightening.Much of our lives are based on judgment calls - on making spot estimates about everything. So, let’s take a look at some estimates we might make:1. “I estimate that car three blocks away will not hit me if I cross the street now.”2. “I estimate these eggs have 2 more minutes.”3. “I estimate that this massive 15 million dollar project will be done in exactly 12 months and take exactly 300 people and will require exactly these tasks to be done in exactly this order each taking exactly this much time.”Which of these three stand the least chance of being correct?If you guessed 1 or 2, then you’re just trying to be wrong. It’s pretty apparent that #3 is a very large thing with many moving parts and a huge helping of unknowns. Yet we frequently estimate work for ourselves or others and then are disappointed when we are wrong.We are wrong for a variety of reasons:

  1. We don’t understand the role of variation in our work

  2. We are estimating before we’ve started the project and are simply underinformed

  3. We are trying to meet a deadline that is shorter than the time it would take to create a quality product

  4. We are trying to come in as a least-cost bid

  5. We are trying to get work done while understaffed

  6. During the project is snows, rains, tornadoes, floods, earthquakes, locust plagues, or other bizarre thing that seems to happen during every project

  7. We don’t want to look “slow”

  8. We don’t have time to do a thorough review

  9. It is politically inadvisable to say what the real estimate is, so we give a lower one and hope to find efficiencies to make up the time

  10. We think about “ideal” hours and estimate based on how long we think we could personally do the work if we were totally focused and never interrupted

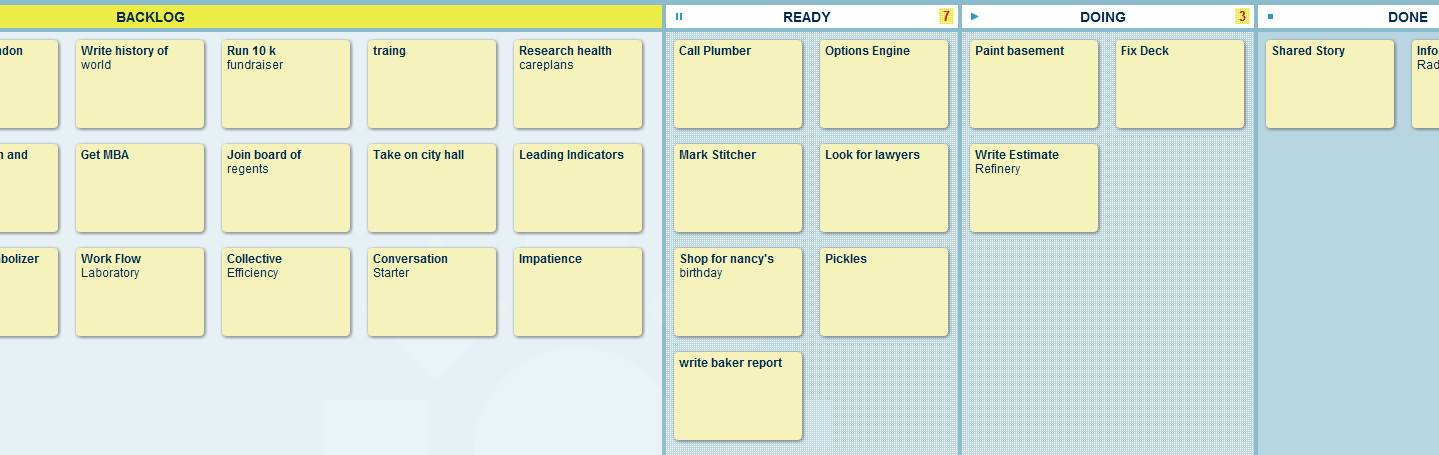
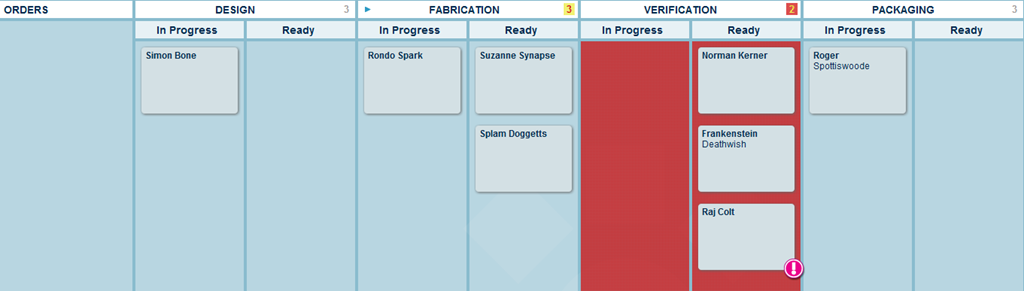
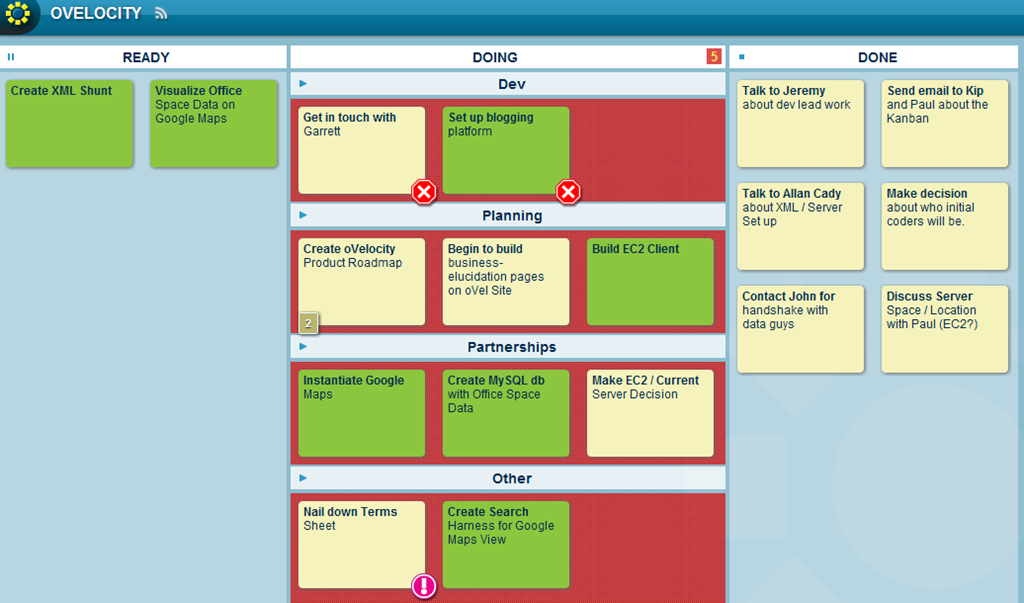
This list could seriously go on for days.Personal Kanban is helpful here because we can begin to track the amount of time it takes to actually complete our work. There are two metrics here: Lead Time and Cycle Time.Lead time is the amount of time it takes to get a ticket from its creation to its completion. Cycle time is the amount of time it takes to get work from the start of actual work to completion.Key here is how we manage our backlog. In most of the Personal Kanban writing, we assume that the backlog is an open repository for all demands. If that’s the case, then it has no limit and we really can’t measure anything against it.However, if we set up something like the system below:Here we have a “backlog” which holds all our prospective tasks forever. So every project we might want to do, goals, whims, it’s all in there. In our “ready” column, however, we have a 7 ticket limit. That limit means that when something enters ready it is probably going to be moved to doing very soon.With this limit we can begin to gather planning-level metrics. So:Lead Time = [Date / time ticket moved into DONE] - [Date / time ticket moved into READY]This says, from the moment something hits my ready column, it takes Lead Time to be completed.Cycle Time = [Date / time ticket moved into DOING] - [Date / Time ticket moved into DONE]This tells us that when we start working on something, it takes Cycle Time to complete.With these numbers we start to see variation in our work. We will see it in a variety of ways.

  • Variation in the set - So we have a set of numbers now that show how long it takes us to complete tasks. Some of them it takes a long time to complete, others it takes a short time to complete. If we graph this, it shows the dispersion of task completion times we have had.

  • Variation in “like” tasks - Let’s say you do the same thing repeatedly. Like checking up on one of your large clients. Usually it is as simple as calling and having a quick 5 minute phone call. But sometimes it doesn’t go right. They have an issue, or maybe they’re just chatty, and you find yourself talking to them for an hour and a half. The task “checkin with client” was the same, but the amount of time it takes to complete it can change. Instinctively, we know this happens, but we never account for it in our estimates.

  • Unforeseen events - Let’s say you’ve designated on task to take 8 hours. You have a week before the deadline and all is good. The day before you’re going to complete it, there is a blizzard that keeps you from completing it for six days.

Most of the time, our estimates are wrong. Often it’s due to us simply not understanding our own work. We don’t understand how often we are interrupted, the role of variation in our work, or simply the work itself. With the kanban and Personal Kanban, we are able to see work as it happens, notice bottlenecks, and measure real completion time.As we see this, we are able to refine estimates on the fly.This is post #5 of the Elements of Kanban Series, click for the full list of 13.

A Leading Indicator–Element #4 of the Kanban

Bottleneck in packaging

overloaded team

smilee board

It seems we’re addicted to metrics. People believe that if you measure something over time, you'll see patterns in the data and act on them. The problem is that most metrics are lagging indicators. These are metrics that can tell you why something happened, but they rarely warn of things that are happening or are about to happen.

While lagging metrics are not necessarily bad, it should be fairly apparent that learning of problems after they've happened does little to help you avoid them in the first place.Kanban and Personal Kanban are real-time systems that provide real-time and leading metrics. The board tells you what is happening, as it is happening.

Patterns in real-time movements help you predict events in the future. While the board is more than capable of creating great lagging indicators like Cumulative Flow Diagrams (CFDs), its real strength lies in showing status in a way that helps avoid missteps and pitfalls.Let's take a look at a few design patterns that exemplify this:In this board we see a fairly standard bottleneck.

Work is flowing smoothly through verification, when we reach packaging we see a bottleneck made explicit by the backup of tickets. When we arrive at a situation like this, the group or groups doing the work have the opportunity to correct immediately. In this case, fabricators can help in verification or might take some time to improve the shop, we may bring in other verifiers, or whatever corrective action might be necessary.

This problem becomes explicit immediately - the moment it happens everyone knows there is a bottleneck that is impeding workflow. There is no need for detailed reports, meetings, or blame - the backup is simply there and  should be addressed.In this board we see a team with too much work.

Their WIP limit is five, and yet they have ten tasks in flight. We also see that people downstream have nothing to do. This is a classic knowledge work problem - workers upstream take on many tasks, cannot complete them all in a timely way, and workers downstream starve for work.

The logical result of this is that the workers upstream will finish all the tasks (somewhat sloppily) towards the end of the deadline, leaving downstream workers little time to do their work. Since the work was done somewhat sloppily, the effort required by downstream workers increases with very tight deadlines. That results in further corner-cutting, resulting in a still more shoddy product.However, our board is showing this up front.

Encouraging workers upstream to adhere to their WIP limits allows them to focus on quality, complete work earlier, and get product to downstream colleagues such that they also have time to do a quality job.Knowledge workers have only one critical piece of machinery, it's their brains. Since the 1950s, we've known that workers in a positive state of mind do a better job  - they work faster, the estimate more honestly, they innovate more.

We can use the kanban to track what psychologists call Subjective Well Being. SWB tends to be a remarkably good indicator of  people's emotional frame of mind. If people in a good mood really do tend to do better work, doesn't it make sense to track how they are feeling? Here we see a board where workers are tracking how they are feeling about particular tasks flowing through their kanban. In you come in and everyone looks happy, then things are probably going well. But if a team is all reporting angry faces, the team is angry RIGHT NOW. Right now their performance is likely impaired.

Do you really want to wait a few weeks and have a meeting about this?  No, the problem is there now, the performance is impaired now - the cost of nipping this problem in the bud is currently at an all-time low. It's not fun to fix this problem, but it is very necessary.

There are many other leading indicators you can get from your Personal Kanban, these are just a few. Use your board to see what’s happening in real time and fix problems in real time. Don’t wait for later. Usually waiting to solve a problem allows that problem to grow, making it more problematic, emotionally draining, and expensive to solve.This is post 4 of a 13 part series. See the full listing of 13 Kanban Elements posts here.*Boards 1 & 2 were made in Lean Kit KanbanBoard 3 was in Google Draw

A Game Board- Element #3 of the Kanban

Whether it's Parcheesi or trading individual stocks, we thrive on games. There are three commonly cited elements for all games: a goal, suspense, and rewards.But most games rely on something even more basic. They have flow - a mixture of structure, story, and events that pull you and peak your interest. As you get caught in the flow of a game, you know the goals you are working toward, the way the game has behaved in the past, and a bounded rationality of what to expect in the future. If something violently outside the rules or expectations of the game happens, you feel that is unfair.The kanban is a game board of work. There are definite goals, a variety of victory and loss conditions, suspense, and certainly flow.Flow is primarily achieved by two things:1. limiting work in progress2. policies or experiments we are running on the boardLimiting WIP is vital for the game to exist at all. All games run on an economy of movement, you must complete a task before you can move on to the next. There is no way to do things “faster”. Adhering to the rules of the game allows for flow which builds suspense and keeps people interest. Keeping true to the game also provides rewards like completion, quality, and continuous improvement.

Information Radiator–Element #2 of the Kanban

A Personal Kanban, perhaps more than anything, is an information radiator - a passive device that sits there and broadcasts, endlessly and without judgment, whatever information is on it. I am doing a good job, I am behind, my team is passionate, my team is melancholy, our quality is great, we have  a quality problem, we're on time, we are late ... it's all there - radiating from the Personal Kanban. The visual control provides status information in real-time, allowing real conversations about work to happen based on real-time data.Normally, our status reports come from memos, graphics, or other snapshots that are out-of-date before they are distributed. They can also come from daily, weekly, or ad hoc status meetings, where people gather to report on the actions of themselves or others verbally. These mechanisms directly rely on people's individual interpretations of events, status, and impacts. They also rely on listeners who will hear above, beyond, or around the politics.Where does "politics" come from anyway? Why would we waste our time when things are so "obvious"?Well, it's because we humans build a definition of the world and then find ways to support that definition.There was a psychological study that had two rooms of participants. One room was filled with people who identified as Right-to-Life. The other room was filled with people who identified as pro-Choice. Researchers gave both rooms the exact same information about birth and abortion statistics from the prior year. Both groups interpreted that information as supporting their cause.The same data, completely different political interpretations.  Things were quite "obvious" to the people in both rooms.Information always begins neutral. We humans like to get excited about things, so we interpret information accordingly.In this case researchers were looking for proof of something called  'Confirmation Bias" - an extremely common cognitive bias where we interpret incoming information in a way that confirms our world-view.We are under the influence of many such interpretive biases.The Personal Kanban seeks to be an amoral or a-rational actor. Not rational or irrational.  Not subscribing to any particular morality. It is an impartial agent reporting the status of things.We then, as individuals or groups, can interpret that information together.

The Shared Story - Element #1 of the Kanban

In the Wizard of Oz, the Wicked Witch of the West was recognized as irrepressibly evil. For decades, people were very comfortable in her conviction and ultimate death sentence. However, in the book Wicked, Gregory Maguire gave her a backstory that completely transformed how we thought about her.  Maguire saw that she and her evilness might have a bit of context.In a story, context is everything. If people only get one view of your work, their view is likely to be stilted, lacking in context, and filed with assumptions. If you don’t have enough information about your co-workers, you will suffer the same fate. If we lack this information, we do not have a clear story about our work – which means that we and our colleagues are all making decisions with different interpretations of how work is actually done.When other people view your Personal Kanban, or you share one with a team, you all see many variables simultaneously, through the same visual mechanism, and in context. That sounds hard, but it’s as easy as reading a comic strip or looking at a map.We see tasks not yet done, tasks in progress, tasks completed. We see the steps we really took to complete those tasks. We see the workload in all its glory. We see our stated and our unstated policies in action. We see the results of politics, procrastination, and passivity.And we construct a shared story. Before we had this shared story, we were dealing with our individual stories, which conflicted in small ways. Sometimes the conflicts were large, but usually they were so small we dismissed them or didn’t even consciously notice them. The problem was, when work went a way that didn’t jibe with someone’s individual story (how they thought the team worked), they would become upset. Often not quite knowing why.There was a disconnect between how things were “supposed” to work, and how they were actually working. Somewhere in that story - that the individuals had in their heads - there were variations that caused frustration.The shared story comes out of the Personal Kanban by the simultaneous structure (common work types, limiting WIP, value stream, etc.) and anti-structure (elements of flow or presentation that don’t look quite “right” to the viewer and prompt questions.)That’s a wordy way of saying that two people can look at a kanban and share a more common interpretation.

" "